Your Statistics
CHASE's statistics page includes a personal section summarizing your own conference so far — useful for feedback conversations or just curiosity about how you did.
What's tracked
- Speaking — total time spoken, number of speeches, number of Points of Information, average and longest speech length, average wait time before being called, your speaking percentile among peers, and your speaking-to-attendance ratio (how much of the time you were present, you actually spent speaking).
- Attendance — total time present and how many committees you attended (relevant if you moved between committees, e.g. as an NSA).
- Voting — how many times you voted Pro, Con, Abstain, and your total votes cast.
- Activity — papers you've sponsored, amendments you've proposed, and how many of your amendments were accepted.
Reading it
Each figure only appears once there's something to show — if you haven't spoken yet, the speaking section stays empty rather than showing zeroes everywhere.
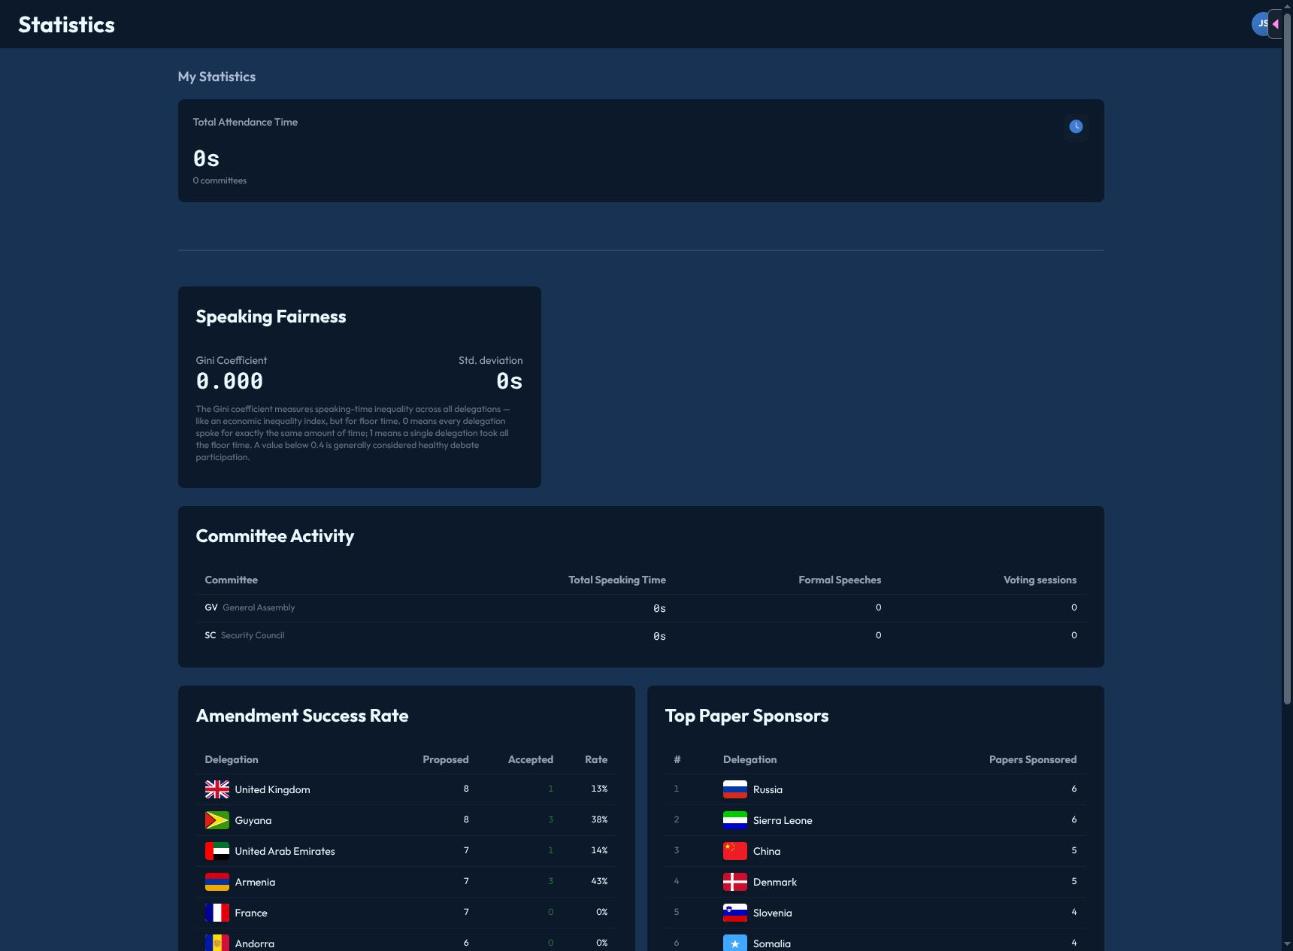
Below your personal numbers, the same page also shows conference-wide figures everyone can see — speaking-time fairness (the Gini coefficient), amendment success rates, and top paper sponsors across the whole conference, not just your own committee.